Apache Airflow® Tutorial
Table of Contents
- Prerequisites
- Get and start Marquez
- Configure Apache Airflow to send events to Marquez
- View Airflow operational analytics and data lineage in Marquez
- Next steps
- Feedback?
Prerequisites
Before you begin, make sure you have installed:
- MacOS/Linux
- Windows
Get and start Marquez
To checkout the Marquez source code, run:
- MacOS/Linux
- Windows
$ git clone https://github.com/MarquezProject/marquez && cd marquez$ git config --global core.autocrlf false
$ git clone https://github.com/MarquezProject/marquez && cd marquezBoth Airflow and Marquez require port 5432 for their metastores, but the Marquez services are easier to configure. You can also assign the database service to a new port on the fly. To start Marquez using port 2345 for the database, run:
- MacOS/Linux
- Windows
$ ./docker/up.sh --db-port 2345Verify that Postgres and Bash are in your
PATH, then run:$ sh ./docker/up.sh --db-port 2345To view the Marquez UI and verify it's running, open http://localhost:3000. The UI allows you to:
- view cross-platform dependencies, meaning you can see the jobs across the tools in your ecosystem that produce or consume a critical table.
- view run-level metadata of current and previous job runs, enabling you to see the latest status of a job and the update history of a dataset.
- get a high-level view of resource usage, allowing you to see trends in your operations.
Configure Airflow to send events to Marquez
To configure Airflow to emit OpenLineage events to Marquez, you need to define an OpenLineage transport. One way you can do this is by using an environment variable. To use
httpand send events to the Marquez API running locally on port5000, run:- MacOS/Linux
- Windows
$ export AIRFLOW__OPENLINEAGE__TRANSPORT='{"type": "http", "url": "http://localhost:5000", "endpoint": "api/v1/lineage"}'$ set AIRFLOW__OPENLINEAGE__TRANSPORT='{"type": "http", "url": "http://localhost:5000", "endpoint": "api/v1/lineage"}'You also need to define a namespace for Airflow jobs. It can be any string. Run:
- MacOS/Linux
- Windows
$ export AIRFLOW__OPENLINEAGE__NAMESPACE='my-team-airflow-instance'$ set AIRFLOW__OPENLINEAGE__NAMESPACE='my-team-airflow-instance'To add the required Airflow OpenLineage Provider package to your Airflow environment, run:
- MacOS/Linux
- Windows
$ pip install apache-airflow-providers-openlineage$ pip install apache-airflow-providers-openlineageTo enable adding a Postgres connection for this tutorial, run:
- MacOS/Linux
- Windows
$ pip install apache-airflow-providers-postgres$ pip install apache-airflow-providers-postgresCreate a database in your local Postgres instance and create an Airflow Postgres connection using the default ID (
postgres_default). For help with the former, see: Postgres Documentation. For help with the latter, see: Managing Connections.Add a flaky DAG to Airflow that will often create a table in the Postgres database:
from __future__ import annotations
import time
import random

import pendulum
from airflow.decorators import dag, task
from airflow.operators.empty import EmptyOperator
from airflow.providers.common.sql.operators.sql import SQLExecuteQueryOperator
from airflow.datasets import Dataset

SQL="""CREATE TABLE IF NOT EXISTS airflowsample (
    col1 VARCHAR(255),
    col2 VARCHAR(255)
)"""

@dag(
    schedule='@hourly',
    start_date=pendulum.datetime(2021, 1, 1, tz="UTC"),
    catchup=False,
    tags=["example"],
    dag_display_name="Flaky DAG",
)

def example_display_name_brkn():

    sample_task_1 = EmptyOperator(
        task_id="sample_task_1",
        task_display_name="Sample Task 1",
    )

    sample_task_2 = SQLExecuteQueryOperator(
        task_id="sample_task_3",
        sql=SQL,
        conn_id="postgres_default",
    )

    @task(
        task_display_name="Sample Task 3",
        outlets=[Dataset("sample_pg_table")]
    )
    def sample_task_3():
        pers = [0, 60, 120, 'fail']
        per = random.choice(pers)
        time.sleep(per)

    sample_task_1 >> sample_task_2 >> sample_task_3()

example_display_name_brkn()
Add another DAG that updates (and then drops) the Postgres table:
from __future__ import annotations
import time
import random

import pendulum
from airflow.decorators import dag, task
from airflow.operators.empty import EmptyOperator
from airflow.providers.common.sql.operators.sql import SQLExecuteQueryOperator
from airflow.datasets import Dataset

SQL_1="INSERT INTO airflowsample (col1) VALUES ('row')"

SQL_2="DROP TABLE airflowsample"

@dag(
    schedule=[Dataset("sample_pg_table")],
    start_date=pendulum.datetime(2021, 1, 1, tz="UTC"),
    catchup=False,
    tags=["example"],
)

def example_insert_brkn():

    sample_task_1 = EmptyOperator(
        task_id="sample_insert_task_1",
        task_display_name="Sample Task 1",
    )

    sample_task_2 = SQLExecuteQueryOperator(
        task_id="sample_insert_task_2",
        sql=SQL_1,
        conn_id="postgres_default",
    )

    sample_task_3 = SQLExecuteQueryOperator(
        task_id="sample_insert_task_3",
        sql=SQL_2,
        conn_id="postgres_default",
    )

    sample_task_1 >> sample_task_2 >> sample_task_3

example_insert_brkn()
This DAG is scheduled on the dataset passed to the
sample_task_3in the first DAG, so it will run automatically when that DAG completes a run.Run your DAGs by triggering the
Flaky DAG. To verify that the OpenLineage Provider is configured correctly, check the task logs for anINFO-level log reporting the transport type you defined. In this case, the log will say:OpenLineageClient will use http transport.
View Airflow operational analytics and data lineage in Marquez
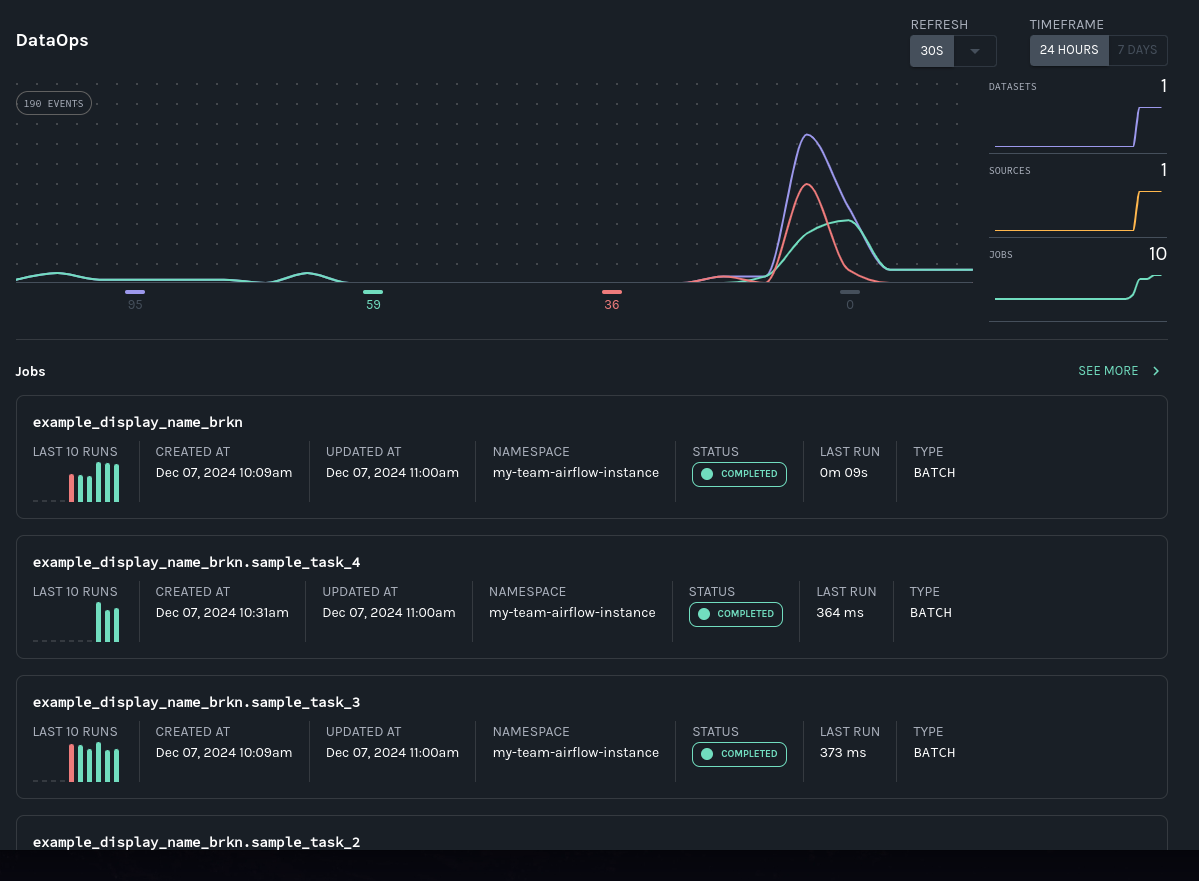
The DataOps view offers a high-level view of historical and in-process operations, including task-level run status and runtime information:

Datasets lineage graph
In the Datasets view, click on the dataset to get a cross-platform-capable lineage graph. In this case, you will be able to see the upstream tasks across the two DAGs in your environment that feed the airflowsample table in Airflow:

Dependencies in other platforms that modify or consume the same dataset will also appear in this graph.
Leveraging the Marquez graph
When data produced by multiple tools in your data ecosystem arrives late or becomes stale, root-cause analysis is much easier when you know:
- what jobs and datasets are upstream.
- what the run status of each upstream job is.
- how each upstream job has performed recently.
- whether quality issues have affected upstream datasets.
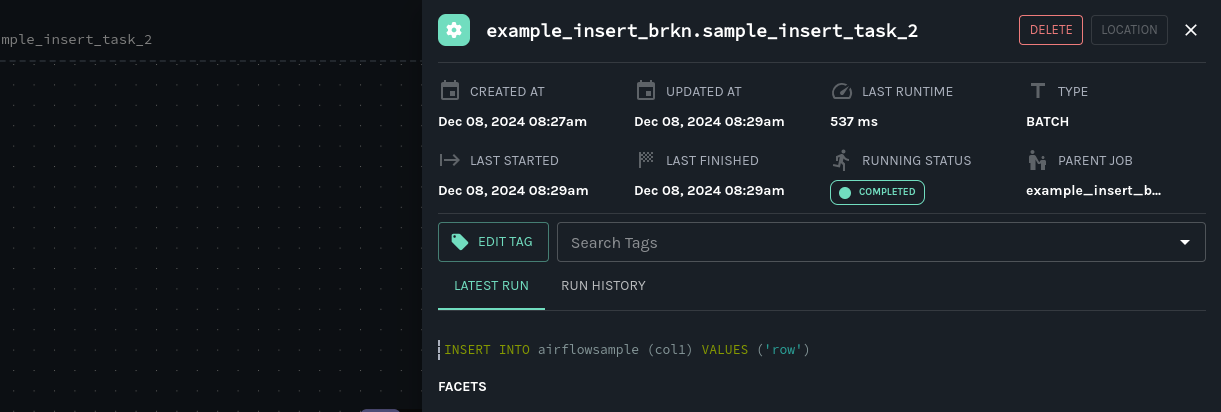
In the Marquez lineage graph, you can click on an upstream job node to see information including:
- the latest run status.
- the last runtime.
- the time last started.
- the time last finished.

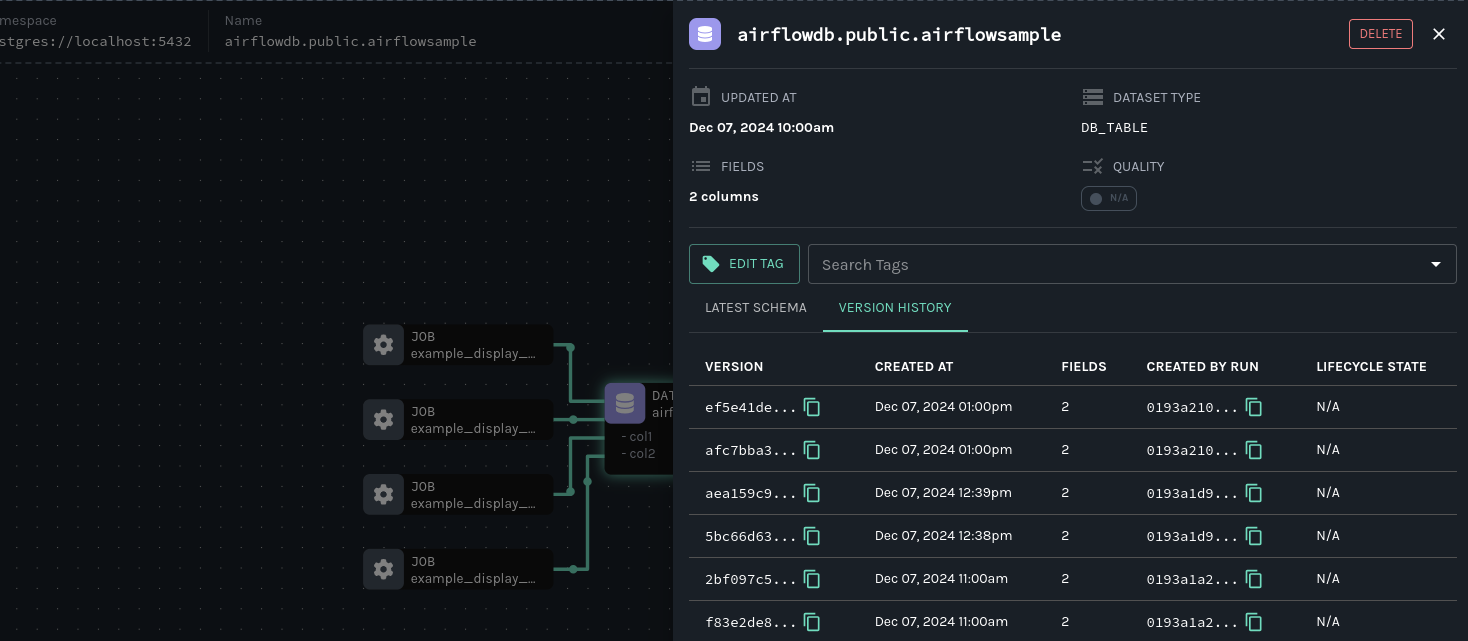
You can also access a versioned table schema history from the Marquez graph, so you can see at a glance if data quality in a table has become compromised and when a loss occurred:

Next steps
Continue your journey with Marquez by consulting the following resources:
Feedback?
What did you think of this guide? You can reach out to us on slack and leave us feedback, or open a pull request with your suggestions!